

The New AI Arms Race Is Infrastructure Economics
CMI Market Intelligence | Insights
February 10, 2026
Executive summary
Jensen Huang and Brad Gerstner framed AI as a once-in-a-generation infrastructure buildout, anchoring their case in utilization: GPUs are rented, queues persist, and idle capacity is scarce.
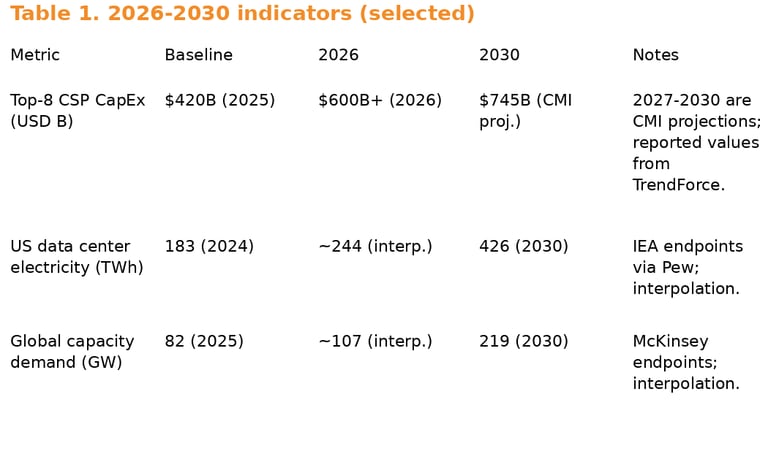
Public investment data supports the scale. TrendForce projects top-eight cloud service provider capital expenditures will exceed $600B in 2026, about 40% higher year over year.
Electricity is the binding input. IEA estimates summarized by Pew put US data center electricity use at 183 TWh in 2024, projected to 426 TWh by 2030.
Hyperscalers are mitigating the bottleneck with long-term PPAs, on-site generation, and nuclear partnerships. The trade-off is longer lead times and first-of-kind risk, but firmer capacity.
Scarcity does not guarantee returns. Utilization can be high while economics deteriorate if inference pricing compresses faster than all-in cost per token.
This is an infrastructure cycle, not a product cycle
Huang and Gerstner rejected the dotcom analogy by focusing on utilization. In the early internet buildout, fiber was laid far ahead of demand and sat idle.
In today’s AI buildout, their claim is the opposite. GPUs are allocated, rented, and often capacity constrained, with limited idle inventory. The ‘no dark GPUs’ line is a statement about present utilization, not a guarantee of permanent pricing power.
TrendForce’s spending data is consistent with an infrastructure cycle. It expects the top eight cloud service providers to spend more than $600B in 2026, up about 40% year over year. That is an industrial-scale investment envelope.
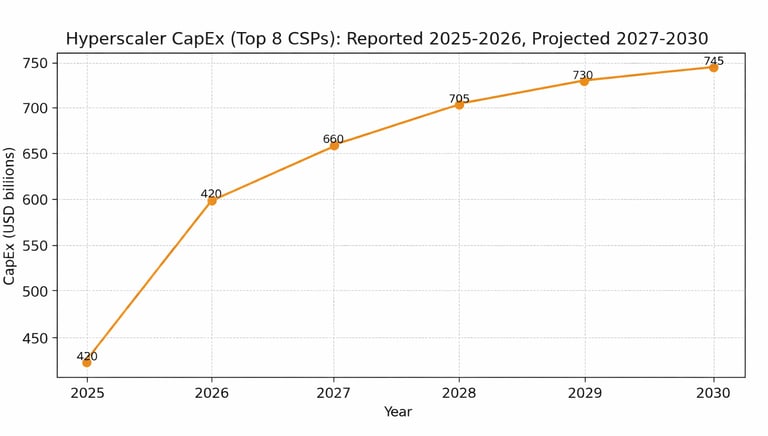
Sources: TrendForce (2025, 2026), 2027-2030 are CMI projections assuming decelerating growth as power, interconnect, and supply constraints
Infrastructure cost is now the center of gravity
The CNBC discussion emphasized model capability and adoption. The more durable driver is infrastructure cost. Silicon matters, but power delivery, interconnect, cooling, construction capacity, and financing increasingly set the pace.
Pew’s synthesis of IEA estimates puts US data center electricity use at 183 TWh in 2024, projected to 426 TWh by 2030. That is a 133% increase. These are utility-scale numbers that shift AI’s economics from ‘software margins’ toward ‘industrial margins.’
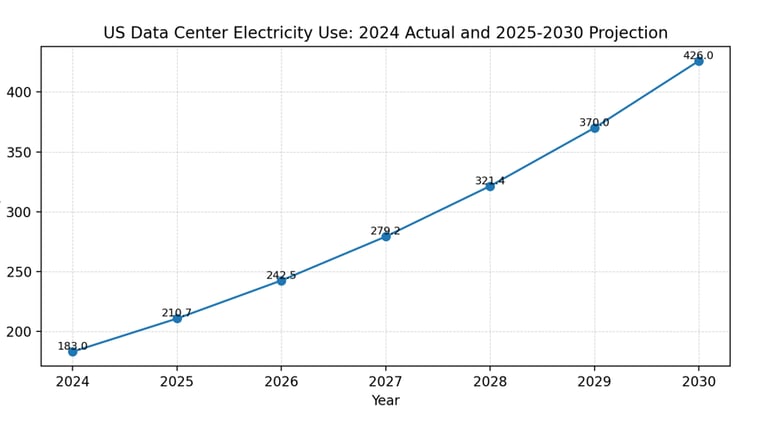
Source: Pew Research Center citing IEA estimate (183 TWh in 2024; TWh projected in 2030). Intermediate years interpolated using CAGI
Demand, capacity, and the 2026-2030 runway
CNBC’s bull case is that demand scales faster than capacity. OpenAI CFO Sarah Friar provides one of the few quantified proxies for that linkage.
Reportedly, OpenAI ended 2025 with about 1.9 GW of compute, up from about 0.2 GW in 2023 and 0.6 GW in 2024. Over the same period, annual recurring revenue was reported to scale from about $2B to $6B to more than $20B.
At the market level, McKinsey estimates global data center capacity demand rising from about 82 GW in 2025 to about 219 GW by 2030. Whether that curve is precise or not, it implies a multi-year buildout where power and interconnect become the gating constraints.
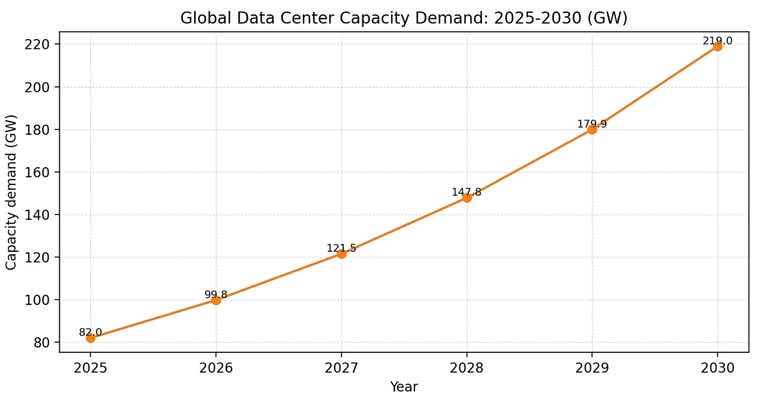
Source: McKinsey's 'Data center demands' (82 GW in 2025; 219 GW in 20130). Inemediate years interpolated using CAGR
The grid is a schedule, with predictable failure modes
Power scarcity is not a binary shortage. It is a queue. Interconnect approvals, substation upgrades, and transformer delivery can take years in constrained regions.
DOE’s Lawrence Berkeley National Laboratory report released in late 2024 projects US data center electricity demand could double or triple by 2028. That pace strains normal utility planning cycles.
The practical failure modes are known. Interconnect delays, permitting litigation, cooling-water constraints, and equipment shortages push projects right. The economic implication is geographic load balancing: workloads route to where power is firm, not where latency is ideal.
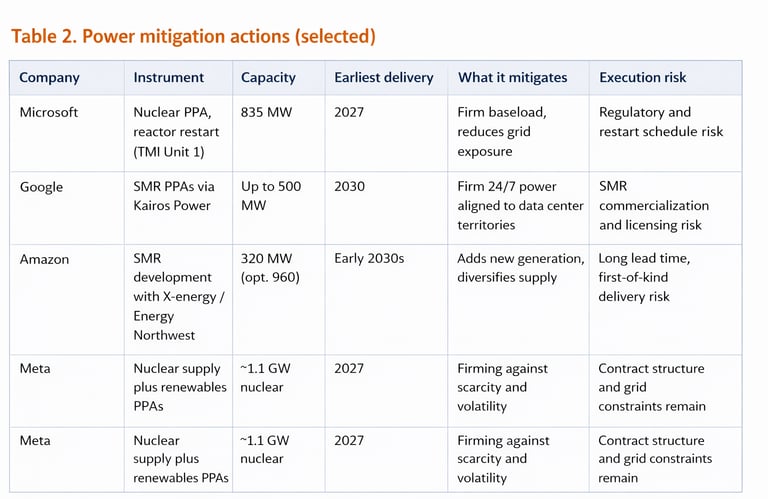
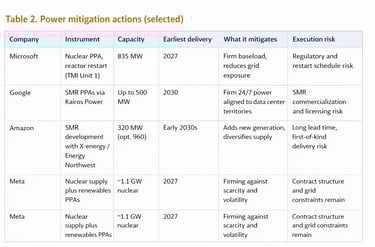
Mitigation is already underway: PPAs are not enough, so hyperscalers are buying firm power
The mitigation playbook is shifting from renewable PPAs alone toward a mix that includes firm power. The goal is not only carbon accounting. It is schedule certainty and operational resilience.
Microsoft signed a long-term agreement with Constellation to support the restart of Three Mile Island Unit 1, targeting about 835 MW by 2027. Google signed with Kairos Power targeting up to 500 MW of advanced nuclear capacity by 2035, with first deployment by 2030.
Amazon partnered with X-energy and Energy Northwest on SMR deployment, with an initial 320 MW phase and an option to expand. Meta has combined renewables at scale with firming initiatives, including a reported nuclear supply agreement tied to about 1.1 GW from Constellation’s Clinton facility beginning in 2027.
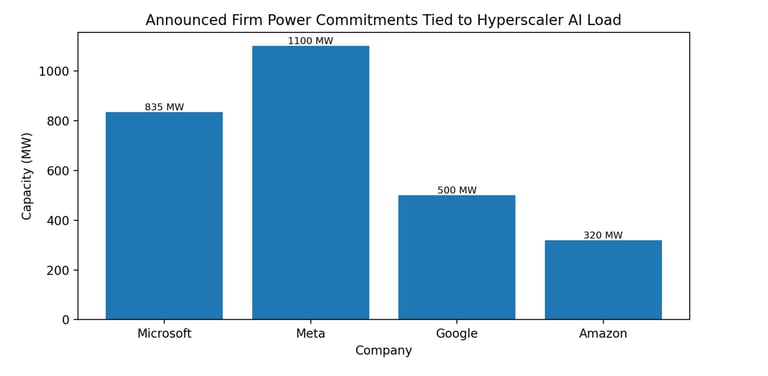
Source: Constellation/Microsoft (835 MW); Meta/Constellation (1.1 GW); Google-Kairos (up to 500 MW by 2035); Amazon-X-energy (320 MW)
Where the narrative diverges: utilization is not the same as profitability
High utilization can coexist with deteriorating economics. If inference prices fall faster than all-in cost per token, aggregate demand can rise while margins compress.
Two other compression channels matter. First, power and networking can rise as a share of total cost, diluting the benefit of silicon gains. Second, buyer concentration increases pricing pressure as hyperscalers fund internal ASIC programs and negotiate harder for price-performance.
2026-2030 scenarios: a disciplined way to frame uncertainty
Base case: CapEx keeps rising but decelerates after 2027. Power constraints ease partially through firm power procurement and load shifting, keeping utilization high but normalizing pricing.
Bull case: permitting and power procurement outpace expectations, maintaining scarcity and sustaining supplier pricing power. Bear case: interconnect and power constraints bind harder than expected, leading to project delays and pockets of underutilized capacity.
What remains unknown, and what would change the conclusion
Key data gaps remain. Hyperscalers do not disclose AI-specific utilization or cost per token. Frontier lab profitability is not consistently transparent, and grid constraints are region-specific.
To move from narrative to underwriting, track four indicators quarterly. Cloud GPU pricing and availability by region. Interconnect queue timing and transformer delivery. The share of load backed by firm power rather than offsets. Evidence that inference monetization scales without steep ARPU compression.
Sources (public): CNBC segment transcript provided by the author (Feb 6, 2026). TrendForce CapEx outlook for top-eight cloud providers (Oct 13, 2025; Nov 6, 2025). Pew Research Center summary of IEA estimates for US data center electricity use (Oct 24, 2025). McKinsey 'Data center demands' (May 20, 2025). US Department of Energy release of the 2024 LBNL report on US data center energy use (Dec 20, 2024). Constellation and Microsoft announcements on the Three Mile Island PPA (Sep 2024; coverage in 2025). Google and Kairos Power announcements on SMR agreement (Oct 2024; follow-on updates in 2025). Amazon and X-energy announcements on SMR partnership (2024-2025). Reported OpenAI compute and ARR figures attributed to CFO Sarah Friar (DataCenterDynamics, Jan 2026).


© 2025 CurveMind Inc. All rights reserved. CMI Market Intelligence is a division of CurveMind Inc.